GPU的利用率到底是怎么回事?#
关于gpu利用率,很多人都存在一些误区。
硬件的利用率一般默认为运行时间占比,但这里有个问题,我们需要去区分是gpu-level还是core-level的利用率呢?
对于gpu-level,但凡有一个core在使用,也可以代表gpu也在被使用啊;对于core-level,那每个core就需要分开来讨论了。
对于cpu而言,它引入了cpu share的概念。例如,在 Kubernetes 环境下,“100m” 的 CPU share 意味着这个容器有 10% 的单核 CPU 资源。通过这种方式,CPU 利用率可以被量化。
遗憾的是在 GPU 上,目前并没有像 CPU share 这样的标准化量化方式。
根据nvidia-smi或者nvidia-smi pmon查看的利用率是什么?#
先看官方定义:
Percent of time over the past sample period during which one or more kernels was executing on the GPU.The sample period may be between 1 second and 1/6 second depending on the product.
翻译一下:采样时间段内,1个及其以上的核(kernel)运行的时间的占比。这个采样时间段取多长,跟产品相关,可能值1/6s~1s。 划重点:“one or more kernels”。这个意味着里面只要有1个kernel在执行,你的GPU利用率也可以很高。 而1个kernel不是一定让GPU内部的运算单元(core)都工作的。只要记住一个事实:GPU利用率99%,并不能说明你的GPU就使出了99%的力气。这个利用率只能说明,有kernel在运算,至于算得怎么样,算力发挥出来了没有,光看这个利用率是判断不出来的。
nvidia-smi反映的是在过去的采样周期内,GPU上是否有一个或多个kernel正在执行。 利用率 (%) 指的是在采样期间内,GPU上有计算任务正在执行的时间比例。例如,如果显示50%的利用率,意味着在采样周期内,有一半的时间GPU正在执行kernel,另一半时间GPU是空闲的。
即使利用率为100%,也不意味着所有CUDA cores都在满负荷工作。它仅表示在采样周期内,GPU上有任务在运行。
相当于说,nvidia-smi看的是gpu-level的时间利用率,而不是空间利用率(core-level)。
参考博客:https://zhuanlan.zhihu.com/p/346389176, https://stackoverflow.com/questions/40937894/nvidia-smi-volatile-gpu-utilization-explanation
我们可以尝试在机器上跑下述代码来验证对nvidia-smi中利用率的理解
#include <stdio.h>
#include <unistd.h>
#include <stdlib.h>

const long long tdelay=1000000LL; //定义了GPU内核中循环等待的时间(以GPU时钟周期为单位)。
const int loops = 10000; //定义了CPU循环执行的次数。
const int hdelay = 1; //定义了CPU在每次循环中调用usleep()时的延迟时间(单位是微秒)。

__global__ void dkern(){ //定义了一个kernel,它通过clock64()函数获取当前的GPU时钟,然后在一个while循环中一直等待,直到经过了tdelay的时间。

  long long start = clock64();
  while(clock64() < start+tdelay);
}

int main(int argc, char *argv[]){

  int my_delay = hdelay;
  if (argc > 1) my_delay = atoi(argv[1]); // 解析参数,允许用户通过命令行设置my_delay的值。
  for (int i = 0; i<loops; i++){ // 使用一个for循环,循环次数为loops,在每次循环中启动dkern内核,然后调用usleep()引入延迟。
    dkern<<<1,1>>>();
    usleep(my_delay);}

  return 0;
}
在这个程序中,dkern内核被启动后,GPU开始执行,而CPU在执行usleep(my_delay)后继续进行下一次循环。这种设计使得CPU和GPU可以并行工作。
当my_delay较小时,CPU在启动内核后很快进入下一次循环,并立即启动下一个GPU内核。这种情况下,GPU可以连续地处理任务,保持高利用率。
总而言之,my_delay参数的值越大,CPU每次启动新任务的间隔时间更长,GPU在两个任务之间空闲的时间变多,即GPU有更多时间处于空转状态。所以这个程序可以验证nvidia-smi展示的是不是时间利用率。
接下来对程序进行编译和运行:
nvcc -o testUtil testUtil.cu
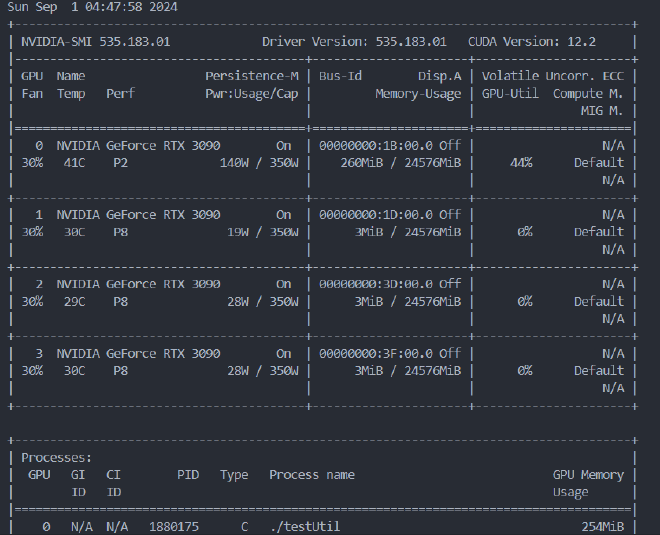
编译后,就可以通过设置my_delay的值来控制这个程序在GPU的活动时间,在3090机器上,./delay_program 100可以达到100%的utilization,但是./delay_program 1000就只有44%的utilization.
sm activity和sm occupation所指的利用率是什么?#
目前国内很少有讨论这个问题,通过调研NVIDIA forum了解到几个工具或许能够用上:pytorch profile、nsight 和nvidia dcgm。考虑到硬件的支持,pytorch profile我不太看好,尤其是对于LLM这种有大量操作的应用来说,这种方案的加载速度很慢。后面的两个方案都可以用。
在指标的选择上,可以使用SM occupation(注意不是SM utilization,这个其实就是nvidia-smi dmon看到的利用率),一个SM包含了多个core,而且SM是CUDA最基本的计算模块,所以这个指标可以代表空间利用率。
MFU和HFU所指的利用率是什么?#
mfu,其实就是每个batch理论上所需要的浮点计算量/每个batch需要的时间/GPU理论峰值浮点计算速度。
观察GPU的工具#
Nsight System#
Nsight profile#
注意概念上的一个定义:profile是对程序而言的,不是对GPU集群。
首先说nvidia profile,其实展示效果相当于tensorboard profile,但更加全面、快速。
踩坑1:nvprof不支持8.0以上的算力
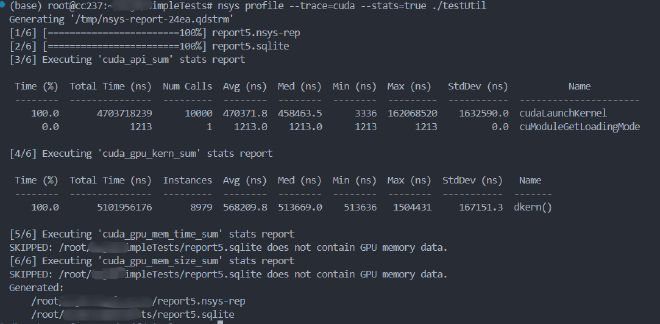
Nsight profile是nvprofile的升级版,对应的指令是nsys profile。会返回很多指标,并且支持通过graphics工具进行可视化。例如:
nsys profile --trace=cuda --stats=true ./your_application
效果为:
这里观测的testUtil仍然是上面的代码,stats是展示输出信息的摘要(不是完整的)。
同时,profile会生成一个nsys-rep,前者可以通过nsys再次读取,也可以通过export功能导出为csv或者sqlite文件
下面的实现参考于博客: https://developer.nvidia.com/zh-cn/blog/measuring-the-gpu-occupancy-of-multi-stream-workloads/
nsys profile --gpu-metrics-device=N
获取到sqlite文件后,执行下述代码进行分析即可:
import sys
import json
import pandas as pd
from nsys_recipe import data_service, log
from nsys_recipe.data_service import DataService

# To run this script, be sure to add the Nsight Systems package directory to your PYTHONPATH, similar to this:
# export PYTHONPATH=/opt/nvidia/nsight-systems/2023.4.1/target-linux-x64/python/packages

def compute_utilization(filename, freq=10000):
    service=DataService(filename)
    table_column_dict = {
        "GPU_METRICS": ["typeId", "metricId", "value"],
        "TARGET_INFO_GPU_METRICS": ["metricName", "metricId"],
        "META_DATA_CAPTURE": ["name", "value"]
    }
    hints={"format":"sqlite"}
    df_dict = service.read_tables(table_column_dict, hints=hints)
    df = df_dict.get("GPU_METRICS", None)
    if df is None:
        print(f"{filename} does not contain GPU metric data.")
        return
    tgtinfo_df = df_dict.get("TARGET_INFO_GPU_METRICS", None)
    if tgtinfo_df is None:
        print(f"{filename} does not contain TARGET_INFO_GPU_METRICS table.")
        return
    metadata_df = df_dict.get("META_DATA_CAPTURE", None)
    if metadata_df is not None:
        if "GPU_METRICS_OPTIONS:SAMPLING_FREQUENCY" in metadata_df['name'].values:
            report_freq = metadata_df.loc[ metadata_df['name']=='GPU_METRICS_OPTIONS:SAMPLING_FREQUENCY']['value'].iat[0]
            if isinstance(report_freq, (int,float)):
                freq = report_freq
                print("Setting GPU Metric sample frequency to value in report file. new frequency=",freq)

    possible_smactive=['SMs Active', 'SM Active', 'SM Active [Throughput %]']
    smactive_name_mask = tgtinfo_df['metricName'].isin(possible_smactive)
    smactive_row = tgtinfo_df[smactive_name_mask]
    smactive_name = smactive_row['metricName'].iat[0]
    smactive_id = tgtinfo_df.loc[tgtinfo_df['metricName']==smactive_name,'metricId'].iat[0]
    smactive_df = df.loc[ df['metricId'] == smactive_id ]

    usage = smactive_df['value'].sum()
    count = len(smactive_df['value'])
    count_nonzero = len(smactive_df.loc[smactive_df['value']!=0])
    avg_gross_util = usage/count
    avg_net_util = usage/count_nonzero
    effective_util = usage/freq/100

    print(f"Avg gross GPU utilization:\t%lf %%" % avg_gross_util)
    print(f"Avg net GPU utilization:\t%lf %%" % avg_net_util)
    print(f"Effective GPU utilization time:\t%lf s" % effective_util)
    return metadata_df

if __name__ == '__main__':
    if len(sys.argv)==2:
        compute_utilization(sys.argv[1])
    elif len(sys.argv)==3:
        compute_utilization(sys.argv[1], freq=float(sys.argv[2]))
代码里的nsys_recipe我也查了半天nvidia的github,看到/usr/local/cuda-12.4/NsightSystems-cli-2024.2.1/target-linux-x64/python/packages/nsys_recipe/requirements/common.txt时才发现端倪,原来是需要安装CLI才能够使用,这个库是cli中提供的python接口。
值得一提的是,nsight现在支持jupyter了,可以在pypi.org中查到: jupyterlab-nvidia-nsight
Nsight Computer#
通过Nsight Compute工具也可以观测到
通过官方文档了解到:
These metrics provide an overview of GPU efficiency over time within compute, graphics, and input/output (IO) activities such as:
IO throughputs: PCIe, NVLink, and GPU memory bandwidth
SM utilization: SMs activity, tensor core activity, instructions issued, warp occupancy, and unassigned warp slots
也就是说,我们只能从SMs activity, tensor core activity, instructions issued, warp occupancy, and unassigned warp slots这几个指标去获取SM的相关利用率。
此外,文档里也提到,kernel很难被优化到100%的tensor core利用率
再读一下官方文档,查到了获取sm activity的命令:
ncu --metrics sm__cycles_active.avg.pct_of_peak_sustained_elapsed ./testUti,效果为:
此外,获取warp active的命令:
ncu --metrics sm__warps_active.avg.pct_of_peak_sustained_active ./testUtil 100,效果为:
DCGM#
nsys 和 ncu 这类 NVIDIA 工具通常是用于分析正在执行的程序的,通常需要附加到正在执行的进程或者通过命令行启动分析任务。这种结果通常是程序结束后的。
而DCGM是针对与数据中心去观测的,甚至支持DCGM Exporter工具,可以衔接上Kubernetes使用。与nvidia-smi一样,结果可以是同时的。
根据官方github的方案去安装dcgm
通过下述命令查看性能分析:
sudo systemctl start nvidia-dcgm
# 通过 -l 了解有哪些参数可以查看,其中10002、10003分别对应
dcgmi dmon -l
# 查看列表发现1002、1003对应于SM occupation,是我们要的指标
dcgmi dmon -e 1002

# 也可以针对指定程序监控
# 启动监控
dcgmi stats --host 127.0.0.1 -g 0 -e
# 暴露某个程序的信息
dcgmi stats --host 127.0.0.1 -g 0 -p <pid> -v
踩坑2:dcgm的性能分析模块(例如1002、1003)仅支持 Tesla/Quadro 级 GPU,不支持 RTX/GTX GPU,也不支持任何容器。
NVML#
nvml(NVIDIA Management Library )这个库也提供相应的功能,而且有python库(pynvml)。NVML已经有比较广泛的应用,比如NVIDIA-smi就是基于NVML库做的.
